Tian J, Keller MP, Broman AT, Kendziorski C, Yandell BS, Attie AD,
Broman KW. The dissection of expression quantitative trait locus
hotspots. Genetics, to appear
![]()
![]()
![]()
![]()
![]()
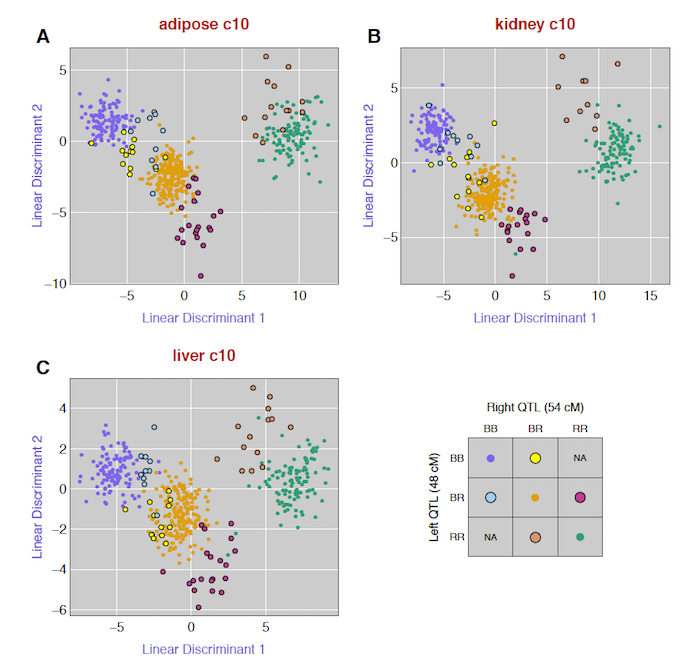
Figure 4. — Scatterplots of the first two linear discriminants for the trans-eQTL hotspot on chromosome 10, here considering three tissues: adipose, kidney, and liver. Points correspond to mice, and they are colored according to their two-locus genotypes, for the inferred two QTL model, with one locus at 48 cM and the other at 54 cM.