R/qtlcharts, an R package to create
interactive data visualizations for QTL data
(see Broman (2015) Genetics 199:359-361)
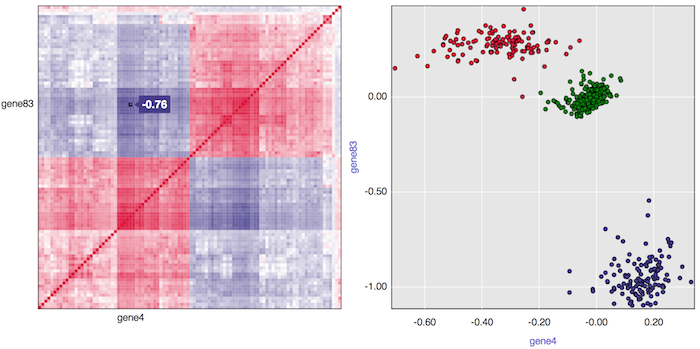
Static view of an interactive graph from R/qtlcharts. The left panel is a heatmap of a correlation matrix; click a pixel and the corresponding scatterplot is shown on the right.